
Fresh grooves in the soil tell your clients a machine passed through. Trip history and live tracking on a telematics platform tell them the same thing (and much more). But neither tells teams how much of the area was actually covered in a day’s work.
Our latest report enhancement solves this problem. We’ve built an area covered calculation directly into an existing report on the 3Dtracking platform to make it easier for clients in the agricultural and road construction sectors to draw insights on productivity - without jumping between systems and tools.
They finish the day with clarity on what was done and what doesn’t need to be repeated, saving time and resources in the field.
Table of contents:
- The cost of not knowing
- Making area covered calculation easier
- How area covered calculation works
- FAQs
The cost of not knowing what was covered
A farm manager could send out two tractors to work the same field. By the end of the day, they know the machines ran for eight hours, but that’s about it. They don’t know how much ground was actually covered, where passes overlapped, or whether sections were missed.
Inputs get double-applied in some areas and skipped in others, fuel costs climb, and the only way to check the work is to drive the field afterward. When it’s time to calculate costs or plan the next job, everything is based on estimates and memory.
The wastage adds up quickly. The margin for error is massive. And by the time issues show up, fuel is already burned.
How our report makes area calculation easier
Getting to accurate area calculation shouldn’t require manual checks or an extensive paper trail, which is why this report brings everything together in one clear view. Your clients can access:
- Exact hectare coverage per field, per machine, per day.
- Clear visibility into overlaps and missed sections.
- Side-by-side comparison of operators, machines, or jobs once users run a report for each.
- Accurate productivity tracking per hectare, not just per hour.
Positive outcomes to sell to your clients
Our dynamic POI Visits + Input Report boasts easy-to-read data that turns daily field activity into outcomes your clients care about. It’s these outcomes (see below) that plant the seeds of business growth, for as efficiency increases, so does revenue potential:
- Less fuel and input waste.
- Accurate cost-per-hectare calculations.
- Clearer monitoring for spraying, planting, or harvesting.
- Indisputable, intuitive reporting for farm owners, managers, or contractors.
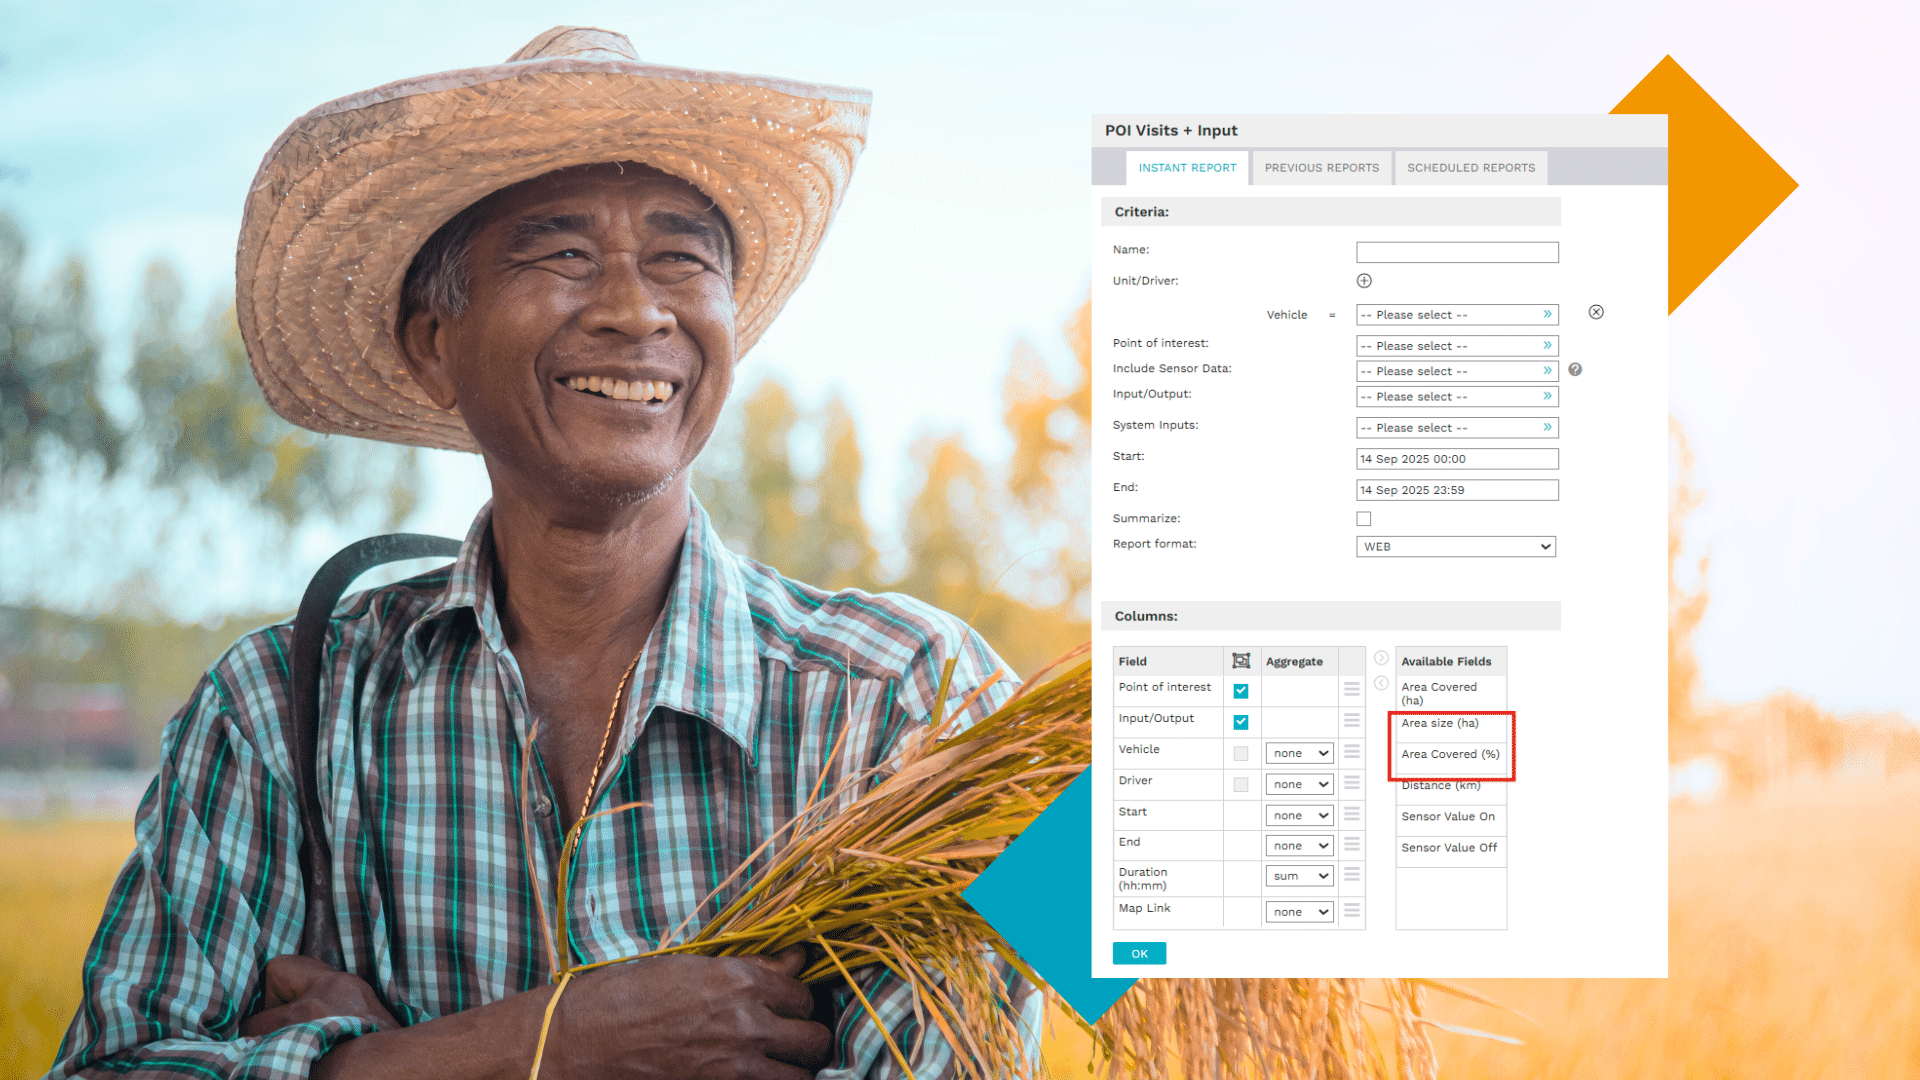
How the area covered calculation works
The updated POI Visits + Input Report in the 3Dtracking platform now includes two new columns to communicate area calculation. The first is area size, which reflects the total size of the point of interest in hectares and is managed in the Admin module. The second is the area covered (%), which shows how much of that area was actually worked during the selected period.
The calculation itself is the area covered in hectares, divided by the total area size, then multiplied by 100 to give a clear percentage.
Area calculation formula: [ Area Covered (ha) / Area Size (ha) ] × 100 = Area Covered (%). This details the total area of the POI in hectares.
To see the updated report live, ask us for a demo.
Frequently asked questions
Can area coverage be tracked per driver or machine?
Yes. Reports can be filtered and compared by machine or time period.
Do clients need special hardware to use the area covered calculation?
No hardware is needed beyond a compatible GPS tracking device that sends location data to our platform.
The area covered calculation turns machine activity into clear output data. Your clients can now make decisions based on facts, rather than assumptions, and avoid doing duplicate work.
Ready to set it up? Chat to your key account manager today or request a demo.